APCs — Mirroring the impact factor or legacy of the subscription-based model? Descriptive statistics.
This blog post is part of a series that explains the study “APCs — Mirroring the impact factor or legacy of the subscription-based model?” of OA2020-DE. After discussing the summary statistics of each variable separately, we present several plots and simple statistical measures showing relationships between two variables. However, keep in mind that finding correlation between two variables does not necessarily imply causality. To state a causal relationship, one needs to run a careful regression analysis, which will be presented in the next blog post.
Relationship between SNIP and APC level
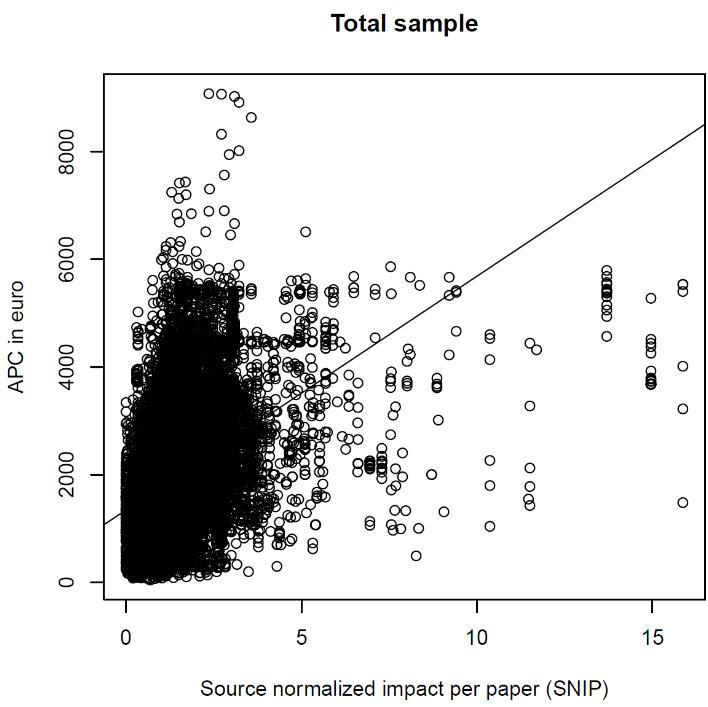
The first figure is a scatter plot between actually paid APCs and the associated “source normalized impact per paper“ (SNIP), i.e. the average citation impact of the publications of a journal. Each point represents an article with its combination of APC and SNIP. The two axes represent the SNIP and the APC level, respectively. In the bottom left corner are plenty of data points so that it appears as a “black area”. The line shows the correlation between APC and SNIP. Although the positive correlation seems to be weak, it is statistically highly significant. Hence, articles in high-impact journals tend to be charged more than in low-impact journals. The intercept shows that (almost) zero-impact journals charge “on average” €1,400 for a publication.

Relationship between open-access-status of a journal and APC level
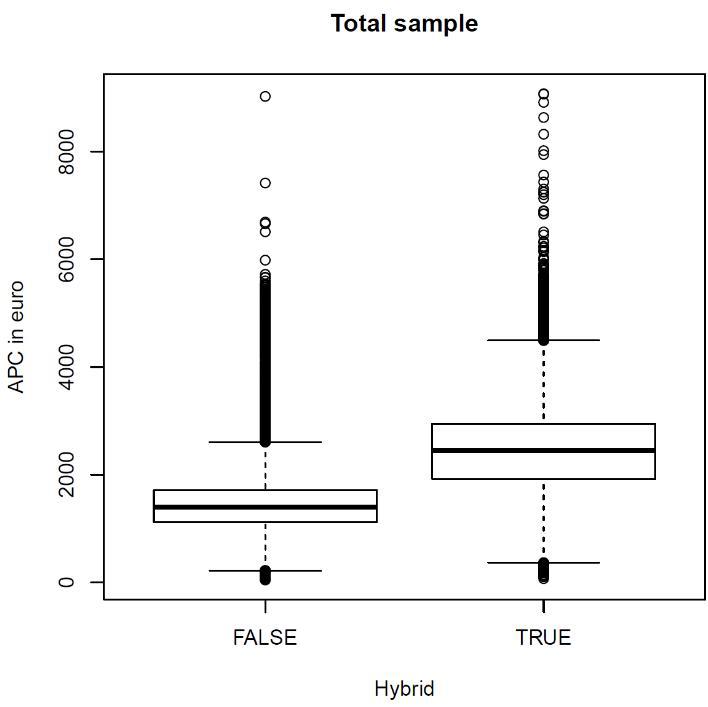
Another potential variable explaining the variation in actually paid APCs might be whether the journal is open-access or hybrid. Hybrid journals are whose that contain closed- as well as open-access articles. The following figure breaks down APC-payments for publications in open-access and hybrid journals, and shows box plots for each group. By this, we can easily see within which range APCs are, how they are distributed, and what the differences between APCs for hybrid and open-access journals are. The box displays the first and the third quartile; the band inside the box is the median. This means that 50 per cent of the APCs lie within the box, and half of the other 50 per cent lies above and below the box, respectively (the vertical lines). The points indicate exceptionally high or low APCs.

One can see that APCs in hybrid journal are much higher than in open-access journals. Although this does not need to be in any case, it is a clear general pattern. The median APC for publications in hybrid journals is about €1,000 costlier than in open-access journals. Moreover, the 25%-quantile for hybrid journals is above the 75%-quantile for open-access journals, which means that three-quarter of the APCs paid to hybrid journals were more expensive than three-quarter of the APCs for open-access journals.
Relationship between open-access-status of a journal and SNIP
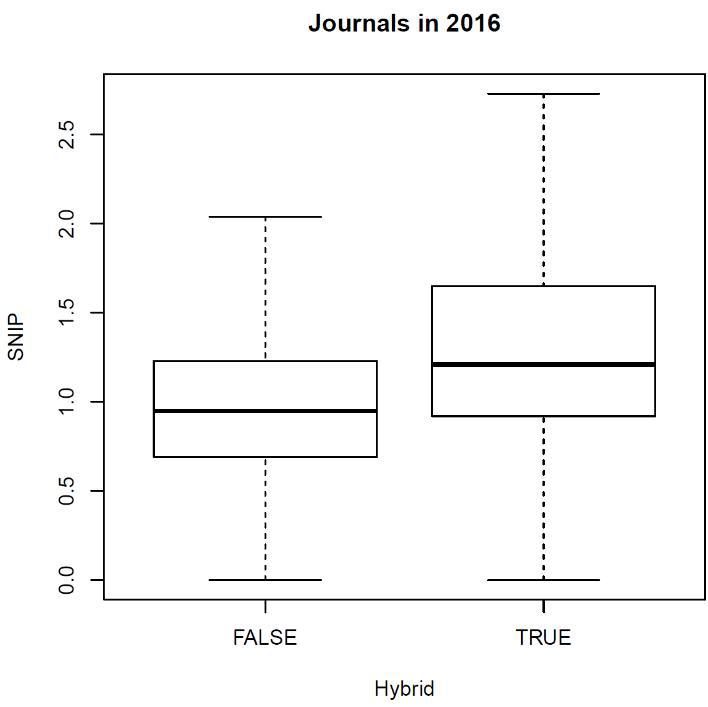
The finding that APCs for publication in hybrid-journals are often much higher than APCs in open-access journals, can partially be resolved by the citation impact. Hybrid journals tend to have higher impact compared to open-access journals (see figure below). To summarize, there is a positive relationship between APCs and SNIP, between APCs and whether the journals is open-access or hybrid, and between SNIP and whether the journals in open-access or hybrid. To isolate the effect of citation impact on APCs, we need to take into account the other relationships that might influence APCs. This is basically what is done in a regression analysis.

Relationship between publisher and APC level
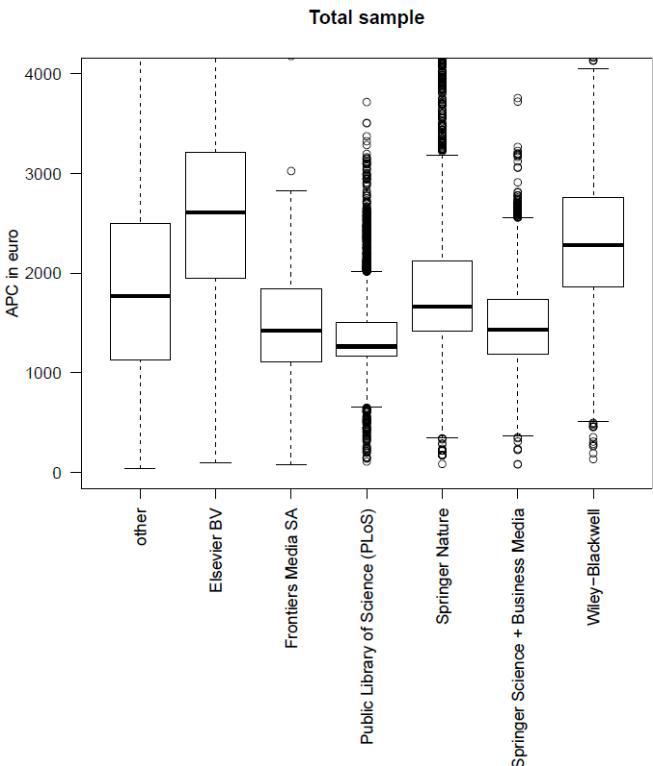
The SNIP and the access-mode of a journal are most probably not the only factors that influence the level of an APC. Publishers might follow different price-setting strategies, or some reputation associated with a publisher label that is not reflected in the SNIP. We can analyze this by comparing APC-levels for each publisher. However, we restrict this exercise to the biggest publisher (according to the OpenAPC-sample) for practical reasons. The APCs for articles to be published by the other publishers are merged to the group “other”.

The figure above displays box plots for each big publisher as well as the group of other publishers. There are wide differences in APCs-levels between the publishers. The median as well as the upper and the lower quartile of APC-payments are the highest for Elsevier, followed by Wiley-Blackwell. This means that these two publishers often charge very high APCs. APCs are relatively low at PLoS, and they do not vary as much as at the other big publishers because of the mega journal PLOS ONE. The publisher show differences not only in setting APCs but in their journal portfolios. The journal portfolios can differ considerable for several characteristics (see, e.g., Figure 6 in report). Therefore, we need a multivariate regression analysis to identify the isolated effects on APC-levels. This analysis will be presented in the next blog post.
More information
Schönfelder, Nina (2018). APCs — Mirroring the impact factor or legacy of the subscription-based model?. Universität Bielefeld. doi:10.4119/unibi/2931061
Blogpost 1 - APCs — Mirroring the impact factor or legacy of the subscription-based model? An introduction.
Blogpost 2 - APCs — Mirroring the impact factor or legacy of the subscription-based model? The database.
